

EncryptionWealthAcademy
Post content & earn content mining yield
placeholder
- Reward
- 16
- 5
- Repost
- Share
ApyWhisperer :
:
The lazy person's investment method is great.View More
JUST IN: Ethereum briefly fell behind Solana in perpetual volume on August 14, recording $2.667 billion compared to Solana's $2.989 billion. However, Ethereum reclaimed its lead, with $2.22 billion on August 15 and 16, while Solana saw $1.635 billion each day. Ethereum remains ahead in DEX volume, signaling potential dominance in the upcoming altcoin season.
- Reward
- like
- Comment
- Repost
- Share
- Reward
- like
- Comment
- Repost
- Share
#STRK# #PI# #BTC# #ETH# #SOL#
The StarkWare and Starknet teams are accused of having sold at least 4% of $STRK Token PANews , according to the X platform "Andrew 10 GWEI", the StarkWare and Starknet teams have sold at least 400 million $STRK Tokens to the market on their network, accounting for about 4% of the total supply. Andrew stated that the actual amount sold may be more, but they are still collecting complete evidence. Additionally, he criticized the team as the "largest extractor" of this cycle, actively releasing bullish statements while continuously selling Tokens
The StarkWare and Starknet teams are accused of having sold at least 4% of $STRK Token PANews , according to the X platform "Andrew 10 GWEI", the StarkWare and Starknet teams have sold at least 400 million $STRK Tokens to the market on their network, accounting for about 4% of the total supply. Andrew stated that the actual amount sold may be more, but they are still collecting complete evidence. Additionally, he criticized the team as the "largest extractor" of this cycle, actively releasing bullish statements while continuously selling Tokens
- Reward
- like
- Comment
- Repost
- Share
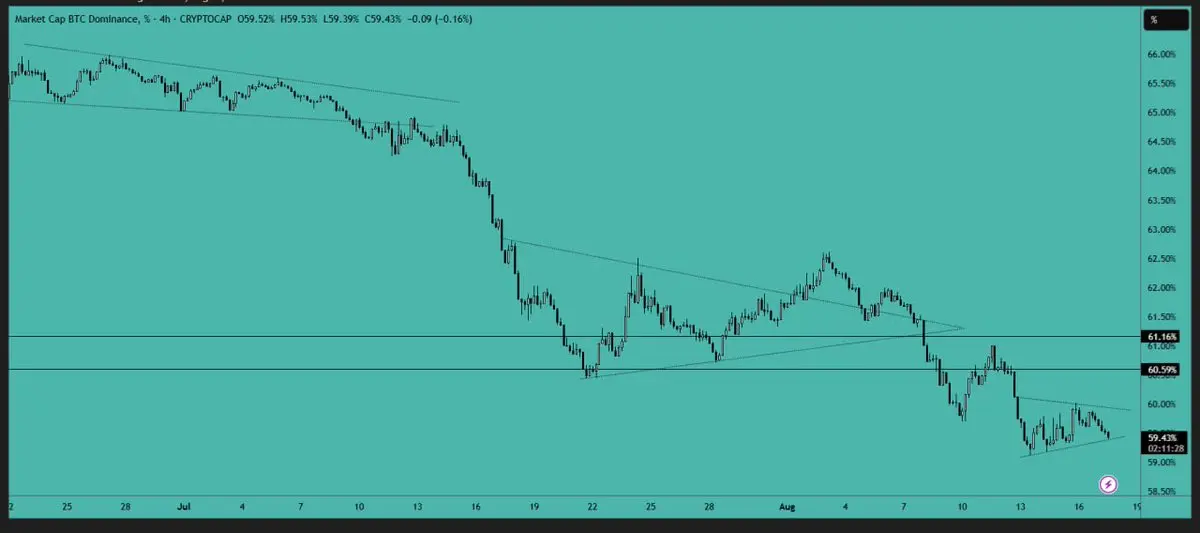
#Bitcoin# # Dominance is forming a small triangle on lower time frames. While # altcoins# experienced a pullback alongside BTC, they are now recovering, which is a positive sign. If there is a break below the triangle, #Bitcoin# # Dominance could drop towards the support area around 58.50%.
$BTC
#crypto
$BTC
#crypto
- Reward
- like
- Comment
- Repost
- Share
Who to follow
More
BitcoinLord
Welcome new fren to join the master
LaoJiu_sLabel
Keep up with Lao Jiu to layout the upcoming super bull market! Missing out on this huge opportunity will definitely be the biggest regret of your life!
CryptoGenius
,
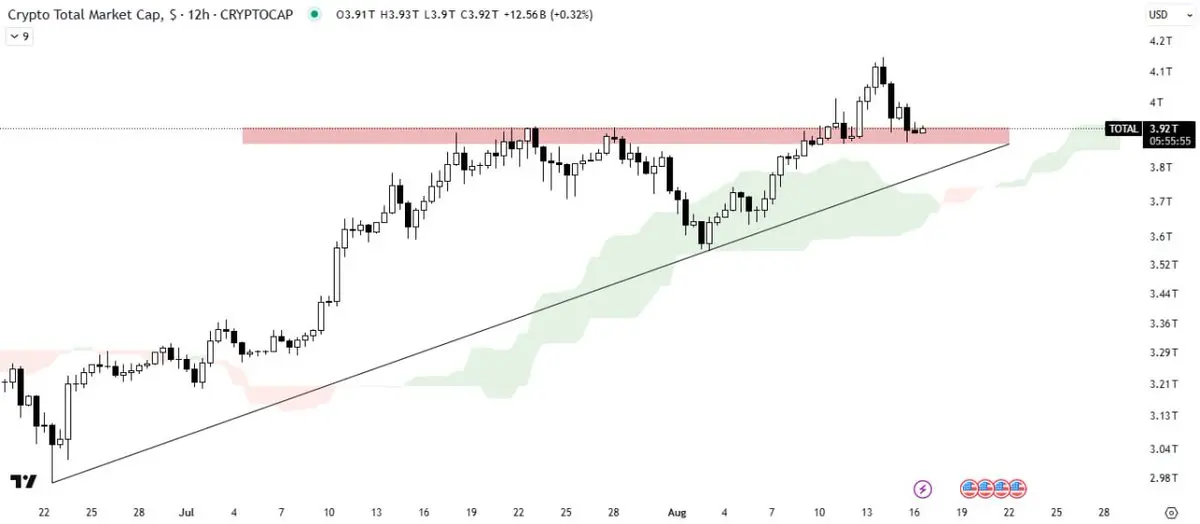
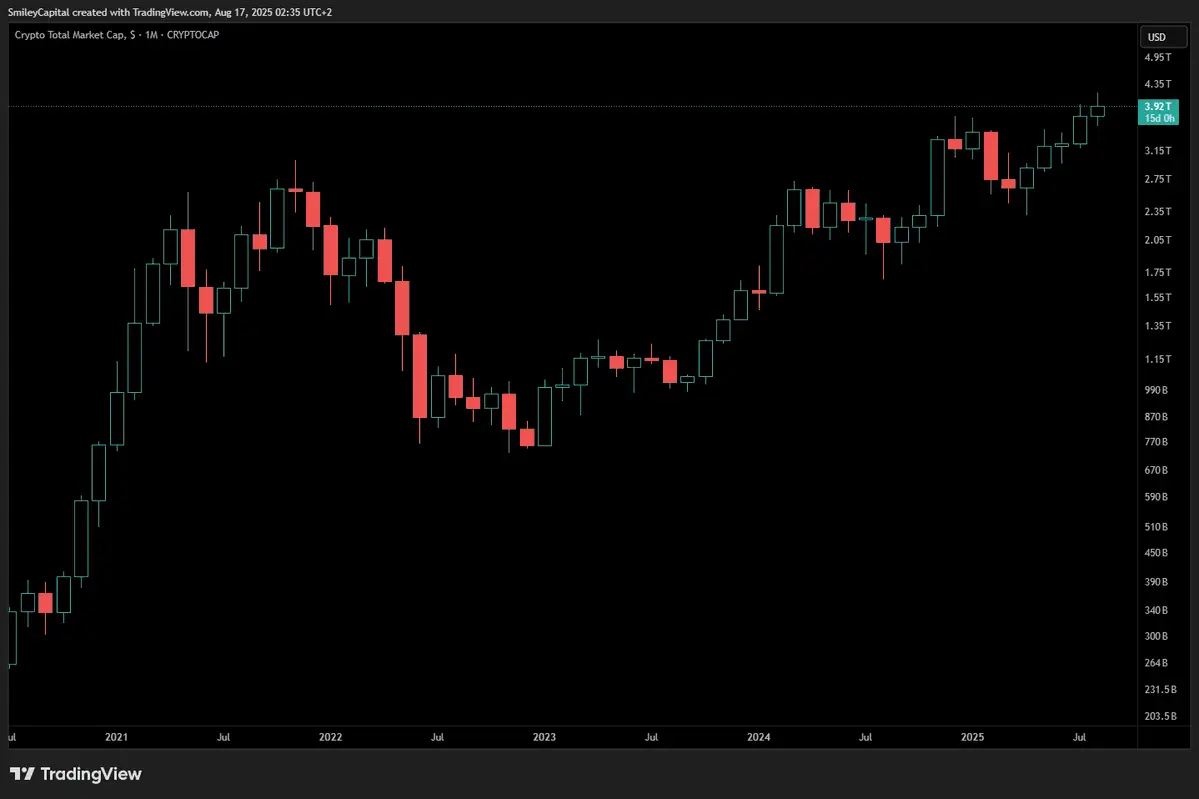
#TOTAL# MARKET CAP ANALYSIS
The total #crypto# market cap has broken out of the ascending triangle pattern with significant volume and is currently retesting the breakout level.
The Ichimoku Cloud is acting as support, indicating strength. A successful retest would confirm a #bullish trend, while a failed retest could lead to further price movement within the pattern.
CLOUD-0.65%
- Reward
- 1
- 1
- Repost
- Share
Ybaser :
:
Just go for it💪 #加密货币市场趋势# Recently, I have been paying attention to Yili Hua's viewpoints, which are indeed insightful. During a bull run, every pullback is an opportunity to increase the position, and I deeply resonate with this. However, he reminds us that being cautious with high leverage is very important. I have been involved in copy trading for many years and have seen too many people get liquidated due to aggressive leverage. My personal advice is to moderately diversify the copy trading targets and balance risks among traders of different styles. For example, it’s normal for BTC to rise to $150,000 a
BTC0.19%
- Reward
- like
- Comment
- Repost
- Share
#PI# How many developers were scammed by the hackathon? Ecological development is costly and labor-intensive with no returns. Developers from previous sessions were left with nothing, suffering greatly. The PI project is like a rat that everyone wants to hit.
The international scam of PI that has spanned seven years has been revealed, and its believers are waking up from their dreams. This junk is the biggest joke in the crypto space. I really don't understand why there are still people spending money to buy this air.
View OriginalThe international scam of PI that has spanned seven years has been revealed, and its believers are waking up from their dreams. This junk is the biggest joke in the crypto space. I really don't understand why there are still people spending money to buy this air.
- Reward
- like
- 7
- Repost
- Share
AllIn,JustDoIt :
:
The largest ecosystem is Snake Pop!View More
#交易机器人# I am using the ETHUSDT contract grid Bots on Gate, with a total yield rate of +7,100.35% since creation.
View Original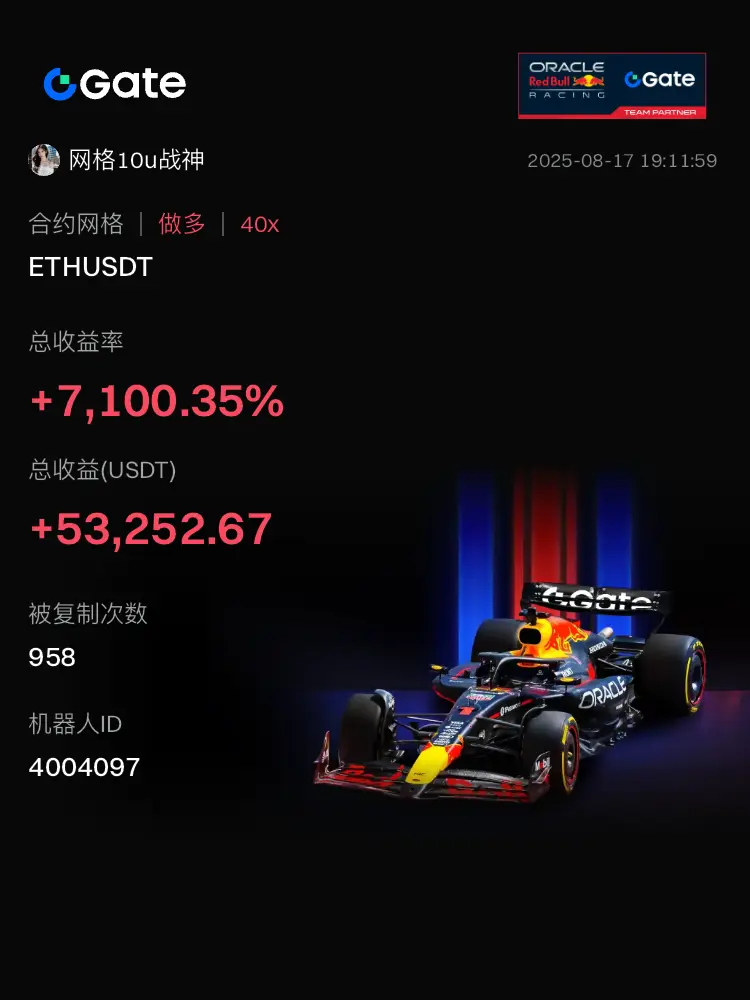
[The user has shared his/her trading data. Go to the App to view more.]
- Reward
- like
- Comment
- Repost
- Share
Conviction > Timing
Everyone on CT loves to talk about “being early.”
But in 90% of cases, “early” just means front-running the next pump and dump or Ponzi scheme. The other 10% are mostly luck or insider access.
True asymmetric upside doesn’t come from chasing hype. It comes from conviction, especially when it feels uncomfortable.
- Holding when everyone fades
- Believing when the mob FUDs
- Doubling down when nobody cares anymore
Being early might look smart, but it’s mostly noise.
However, conviction is a strategy.
Forge your own luck.
- Reward
- like
- Comment
- Repost
- Share
#以太坊市场表现分析# Good news! The open interest of BTCS's ETH has exceeded 70,000! This shows that institutions have strong confidence in ETH. Although we ordinary users can't buy that much, we can still allocate some ETH moderately. Remember to follow new project airdrops and prepare for interactions. I will continue to organize the latest airdrop map for everyone, teaching you how to complete interactions at the lowest cost. Keep participating, and little by little, you might save up a small fortune one day! fighting!
ETH2.92%
- Reward
- like
- Comment
- Repost
- Share

- Reward
- like
- Comment
- Repost
- Share
Today, the crypto assets market presents a diversified pattern. The price of Bitcoin remains fluctuating within a narrow range, with small-scale capital inflows during the Asian trading session. On-chain data shows that market support is still solid. Ethereum is in a slight fluctuation state, and market analysis suggests that a chip cleaning process may be underway, with potential downward space in the short term, but this does not affect the medium-term rebound trend.
In terms of institutional investment, Norway's sovereign wealth fund significantly increased its holdings in Bitcoin-related a
View OriginalIn terms of institutional investment, Norway's sovereign wealth fund significantly increased its holdings in Bitcoin-related a
- Reward
- 7
- 6
- Repost
- Share
LeverageAddict :
:
Is it still time to catch a falling knife?View More
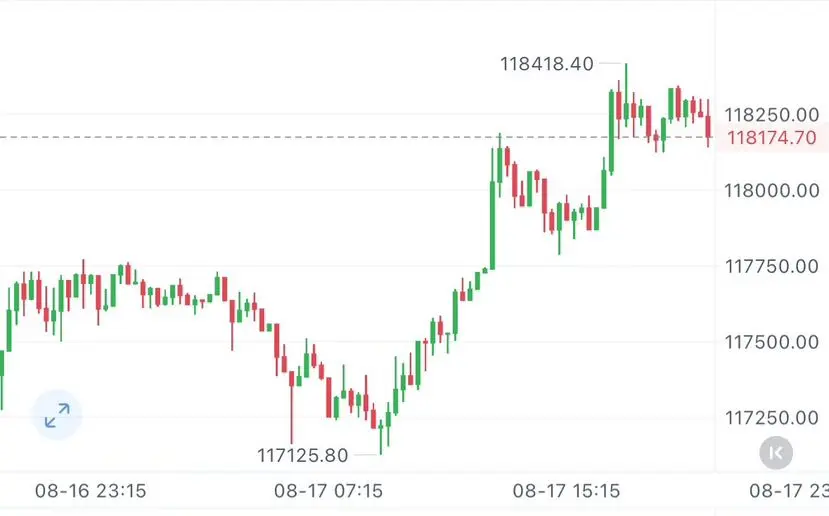
BTC is still bullish in the long term next week, with the specific strategy as follows:
The weekly rising channel is intact, with the current price around 117300. If it holds above 115000, it will look towards 125000-130000 in the medium term; however, the daily chart shows a pullback, breaking below the MA20 moving average, with MACD showing a death cross and RSI (14) at 45, indicating a short-term bearish trend.
Support level 115000-116000, if it breaks down or dips to 112000, it may even trigger selling pressure; resistance level 119000, only a breakthrough with a strong bullish candle can
View OriginalThe weekly rising channel is intact, with the current price around 117300. If it holds above 115000, it will look towards 125000-130000 in the medium term; however, the daily chart shows a pullback, breaking below the MA20 moving average, with MACD showing a death cross and RSI (14) at 45, indicating a short-term bearish trend.
Support level 115000-116000, if it breaks down or dips to 112000, it may even trigger selling pressure; resistance level 119000, only a breakthrough with a strong bullish candle can
- Reward
- like
- Comment
- Repost
- Share

- Reward
- like
- 1
- Repost
- Share
Greygrey:
The law is not written for fools.The Thai government is set to launch a groundbreaking travel payment program aimed at providing more convenience for foreign tourists. It is reported that the program, named TouristDigiPay, will officially start next Monday, allowing tourists to exchange digital assets for Thai baht for consumption within Thailand.
This initiative not only reflects Thailand's spirit of innovation in the digital financial sector but also demonstrates its commitment to promoting the recovery of the tourism industry. However, to ensure the security and compliance of transactions, the plan will operate under a str
View OriginalThis initiative not only reflects Thailand's spirit of innovation in the digital financial sector but also demonstrates its commitment to promoting the recovery of the tourism industry. However, to ensure the security and compliance of transactions, the plan will operate under a str
- Reward
- 14
- 6
- Repost
- Share
PerennialLeek:
Regulation is quite complicated, but Alipay is still appealing.View More
#交易机器人# I am using the DOGEUSDT contract grid Bots on Gate, with a total return rate of +12,297.08% since creation.
View Original
[The user has shared his/her trading data. Go to the App to view more.]
- Reward
- like
- Comment
- Repost
- Share
Load More
Join 30 million users in our growing community
⚡️ Join 30 million users in the crypto craze discussion
💬 Engage with your favorite top creators
👍 See what interests you
- Topic
40k Popularity
41k Popularity
149k Popularity
5k Popularity
19k Popularity
Who to follow
More
BitcoinLord
Welcome new fren to join the master
LaoJiu_sLabel
Keep up with Lao Jiu to layout the upcoming super bull market! Missing out on this huge opportunity will definitely be the biggest regret of your life!
CryptoGenius
,
ALPHABrotherHai
Ride with the trend, accompany with profit.
VVDD
Top active user
No record
- Pin
- 🎉 Hey Gate Square friends! Non-stop perks and endless excitement—our hottest posting reward events are ongoing now! The more you post, the more you win. Don’t miss your exclusive goodies! 🚀
🆘 #Gate 2025 Semi-Year Community Gala# | Square Content Creator TOP 10
Only 1 day left! Your favorite creator is one vote away from TOP 10. Interact on Square to earn Votes—boost them and enter the prize draw. Prizes: iPhone 16 Pro Max, Golden Bull sculpture, Futures Vouchers!
Details 👉 https://www.gate.com/activities/community-vote
1️⃣ #Show My Alpha Points# | Share your Alpha points & gains
Post your - 💙 Gate Square #Gate Blue Challenge# 💙
Show your limitless creativity with Gate Blue!
📅 Event Period
August 11 – 20, 2025
🎯 How to Participate
1. Post your original creation (image / video / hand-drawn art / digital work, etc.) on Gate Square, incorporating Gate’s brand blue or the Gate logo.
2. Include the hashtag #Gate Blue Challenge# in your post title or content.
3. Add a short blessing or message for Gate in your content (e.g., “Wishing Gate Exchange continued success — may the blue shine forever!”).
4. Submissions must be original and comply with community guidelines. Plagiarism or re