

- Topic
18k Popularity
14k Popularity
11k Popularity
3k Popularity
2k Popularity
- Pin
- 🎉 Hey Gate Square friends! Non-stop perks and endless excitement—our hottest posting reward events are ongoing now! The more you post, the more you win. Don’t miss your exclusive goodies! 🚀
1️⃣ #TokenOfLove# | Festival Ticket Giveaway
Cheer for your idol on Gate Square! Pick your favorite star — HyunA, SUECO, DJ KAKA, or CLICK#15 — and post with SingerName + TokenOfLove hashtag to win one of 20 music festival tickets.
Details 👉 https://www.gate.com/post/status/13217654
2️⃣ #GateTravelSharingAmbassadors# | Share Your Journey, Win Rewards
Gate Travel is now live! Post with the hashtag and sha - 🎤 Cheer for Your Idol · Gate Takes You Straight to Token of Love! 🎶
Fam, head to Gate Square now and cheer for #TokenOfLove# — 20 music festival tickets are waiting for you! 🔥
HyunA / SUECO / DJ KAKA / CLICK#15 — Who are you most excited to see? Let’s cheer together!
📌 How to Join (the more ways you join, the higher your chance of winning!)
1️⃣ Interact with This Post
Like & Retweet + vote for your favorite artist
Comment: “I’m cheering for Token of Love on Gate Square!”
2️⃣ Post on Gate Square
Use hashtags: #ArtistName# + #TokenOfLove#
Post any content you like:
🎵 The song you want to he - ✈️ Gate Square | Gate Travel Sharing Event is Ongoing!
Post with #Gate Travel Sharing Ambassadors# on Square and win exclusive travel goodies! 💡
🌴 How to join:
1️⃣ Post on Square with the hashtag #Gate Travel Sharing Ambassadors#
2️⃣ You can:
Share the destination you most want to visit with Gate Travel (hidden gems or hot spots)
Tell your booking experience with Gate Travel (flights/hotels)
Drop money-saving/usage tips
Or write a light, fun Gate Travel story
📦 Prizes:
🏆 Top Ambassador (1): Gate Travel Camping Kit
🎖️ Popular Ambassadors (3): Gate Quick-Dry Travel Set
🎉 Lucky Participant
This statistic hints at extended Bitcoin losses in the next 7 days
As Bitcoin (BTC) faces the renewed threat of plunging below the $110,000 support amid a broader market sell-off, historical data suggests the asset may be destined for more losses in September.
Since 2015, Bitcoin has managed only a 40% win rate in September, with an average return of -2.5%, according to data from charting platform TrendSpider shared on August 25.
TrendSpider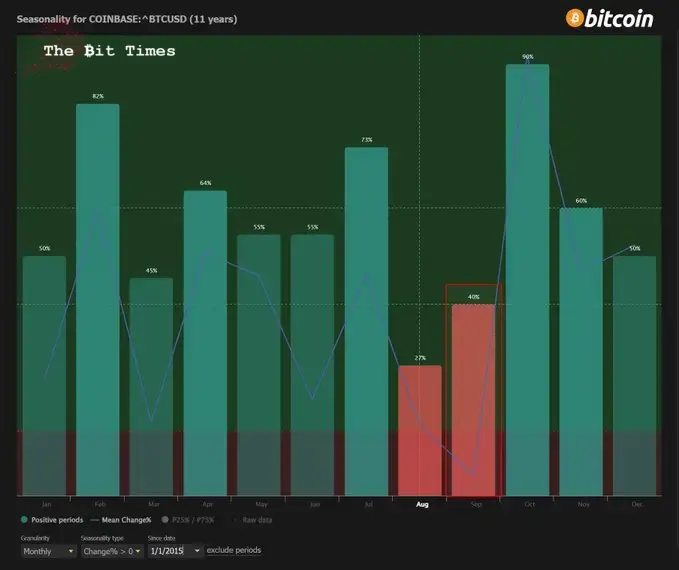 Bitcoin seasonality chart. Source: TrendSpider Bitcoin seasonality chart. Source: TrendSpider The seasonality outlook points to a bearish trend, placing September alongside August as one of the least favorable months for BTC holders
In contrast, months such as February and October have delivered outsized gains, boasting win rates of 82% and 90% respectively.
BTC’s new bearish sentiment
Notably, the statistic emerges at a time when Bitcoin is grappling with fresh bearish sentiment, as whale selling and exchange-traded fund outflows weigh on investors’ confidence. To this end, analysts have laid out several scenarios for the flagship cryptocurrency.
In this line, according to pseudonymous cryptocurrency analyst BitBull, Bitcoin has once again rebounded from its 50-day Exponential Moving Average (EMA), a level that has served as a reliable support throughout the current bull cycle.
BitBull,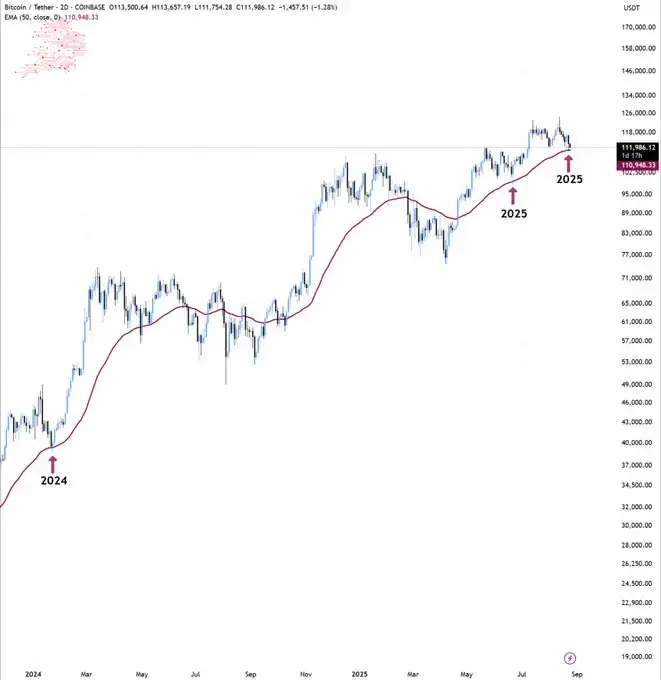 Bitcoin price analysis chart. Source: BitBull**Bitcoin price analysis chart. Source: BitBullHowever, the analyst cautioned that the bottom may not yet be in. Historically, Bitcoin has dipped below the 50-EMA, triggering capitulation and shaking out overleveraged traders before resuming its uptrend.
Based on this pattern, a potential move toward the $106,000 to $108,000 range remains possible. While painful in the short term, such a retracement could act as a final bear trap before Bitcoin begins its next leg higher, according to BitBull.
Bitcoin price analysis
By press time, Bitcoin was trading at $111,555, down nearly 2.7% in the last 24 hours.
Featured image via Shutterstock
Featured image via ShutterstockFeatured image via Shutterstock