CYFYufeng
No content yet

- Reward
- like
- Comment
- Repost
- Share

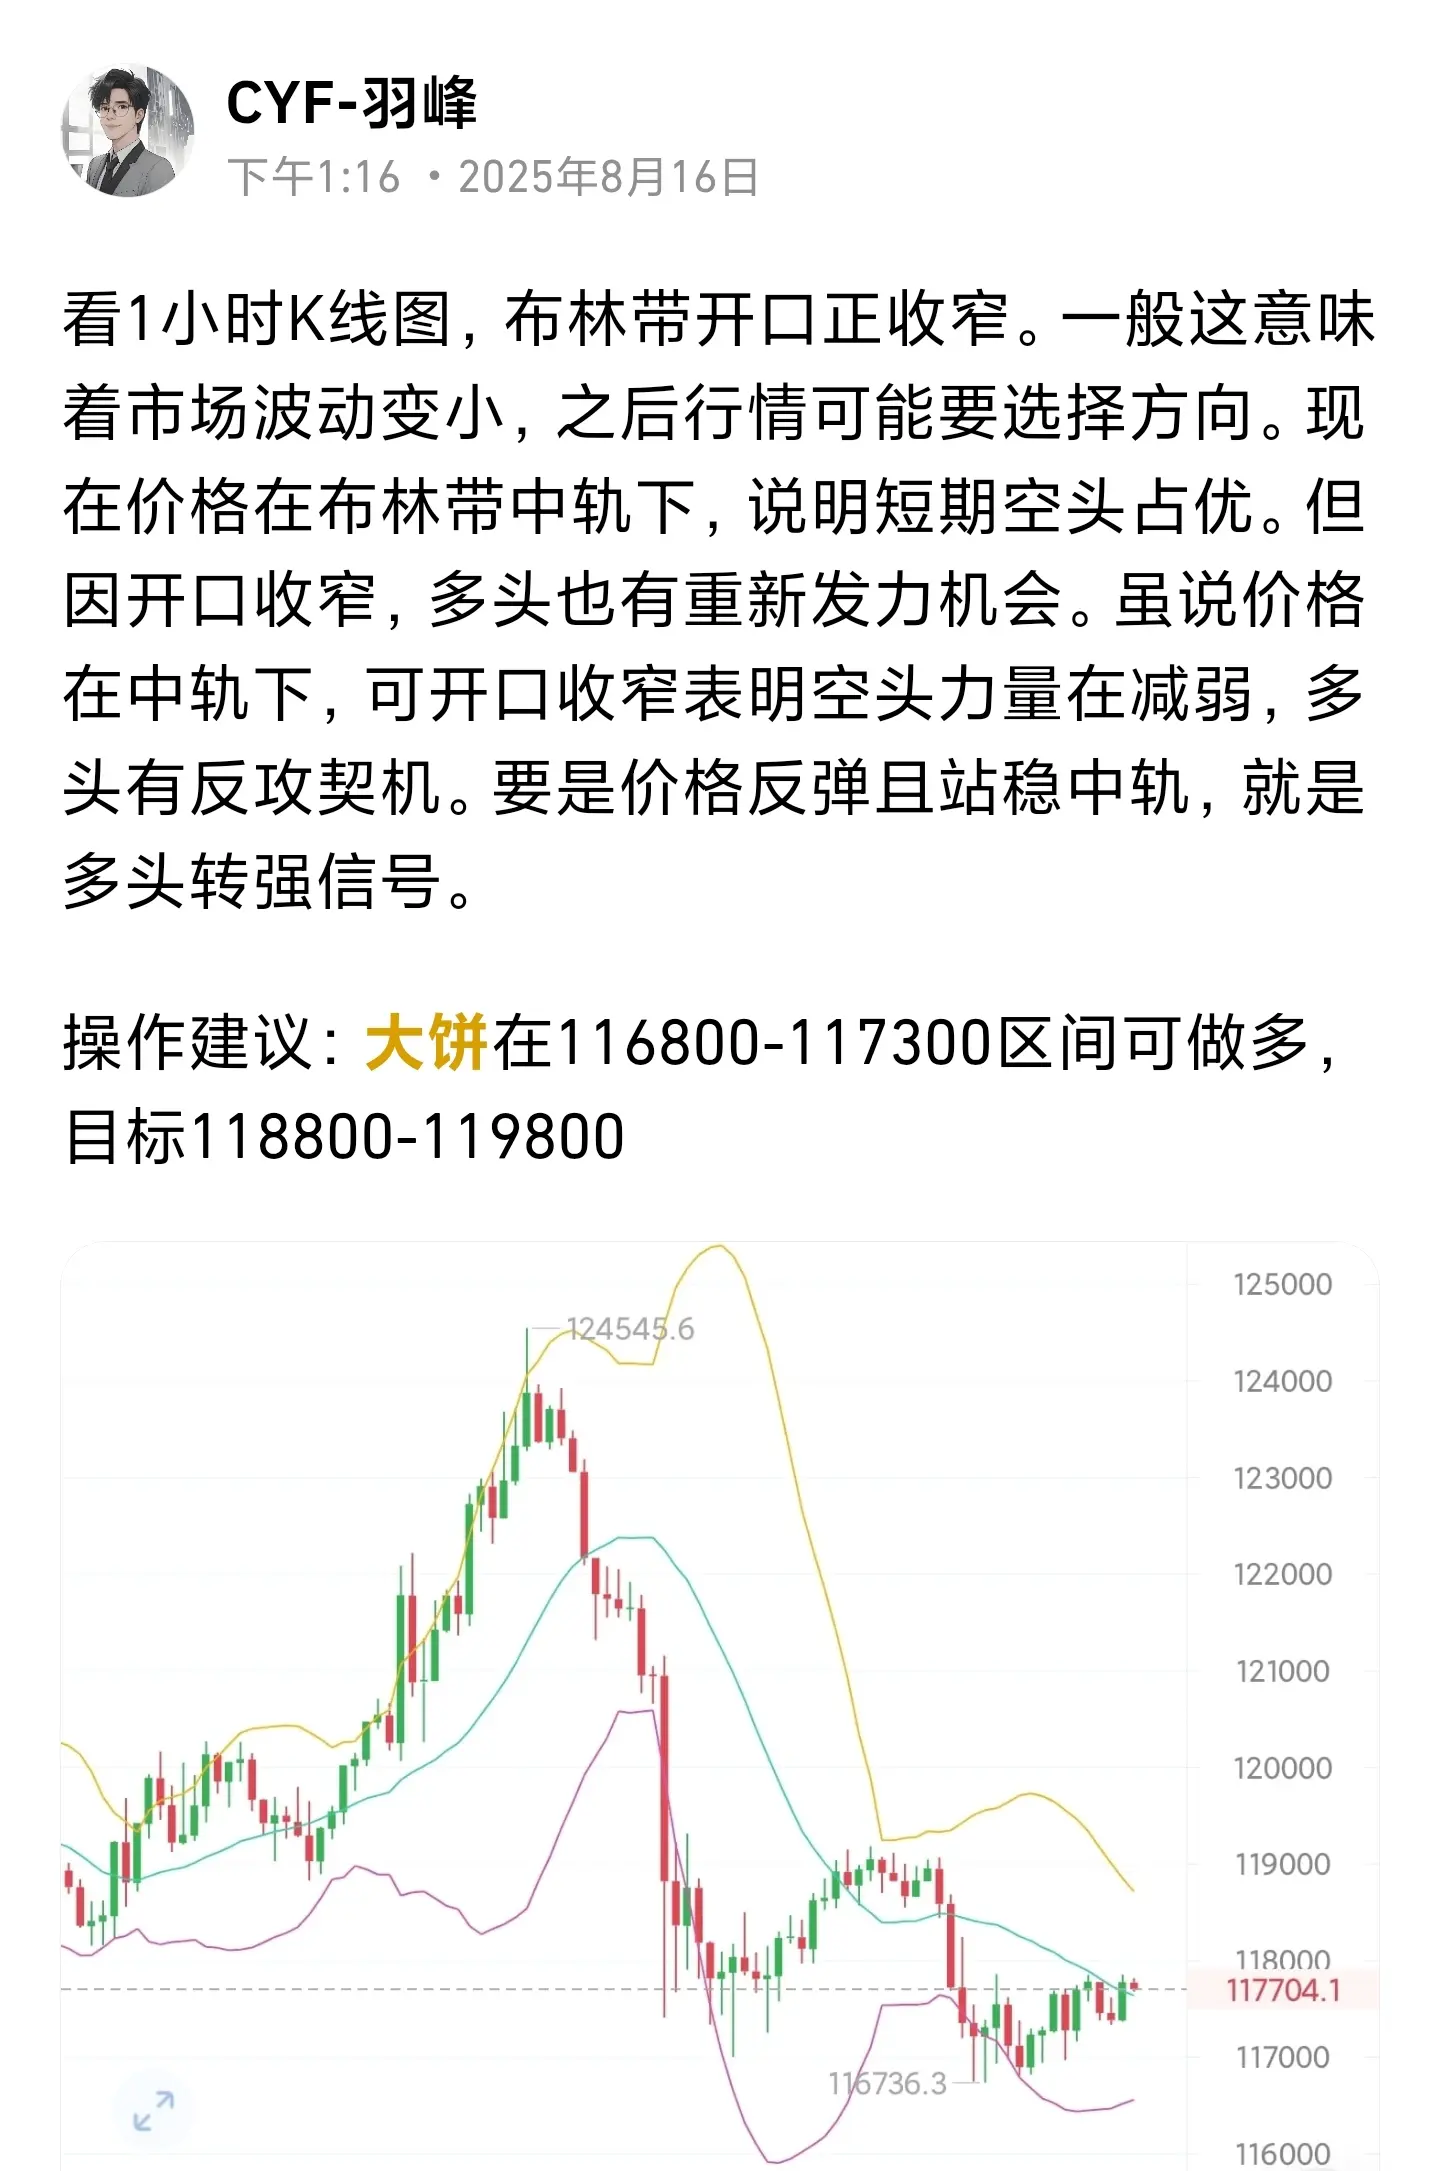
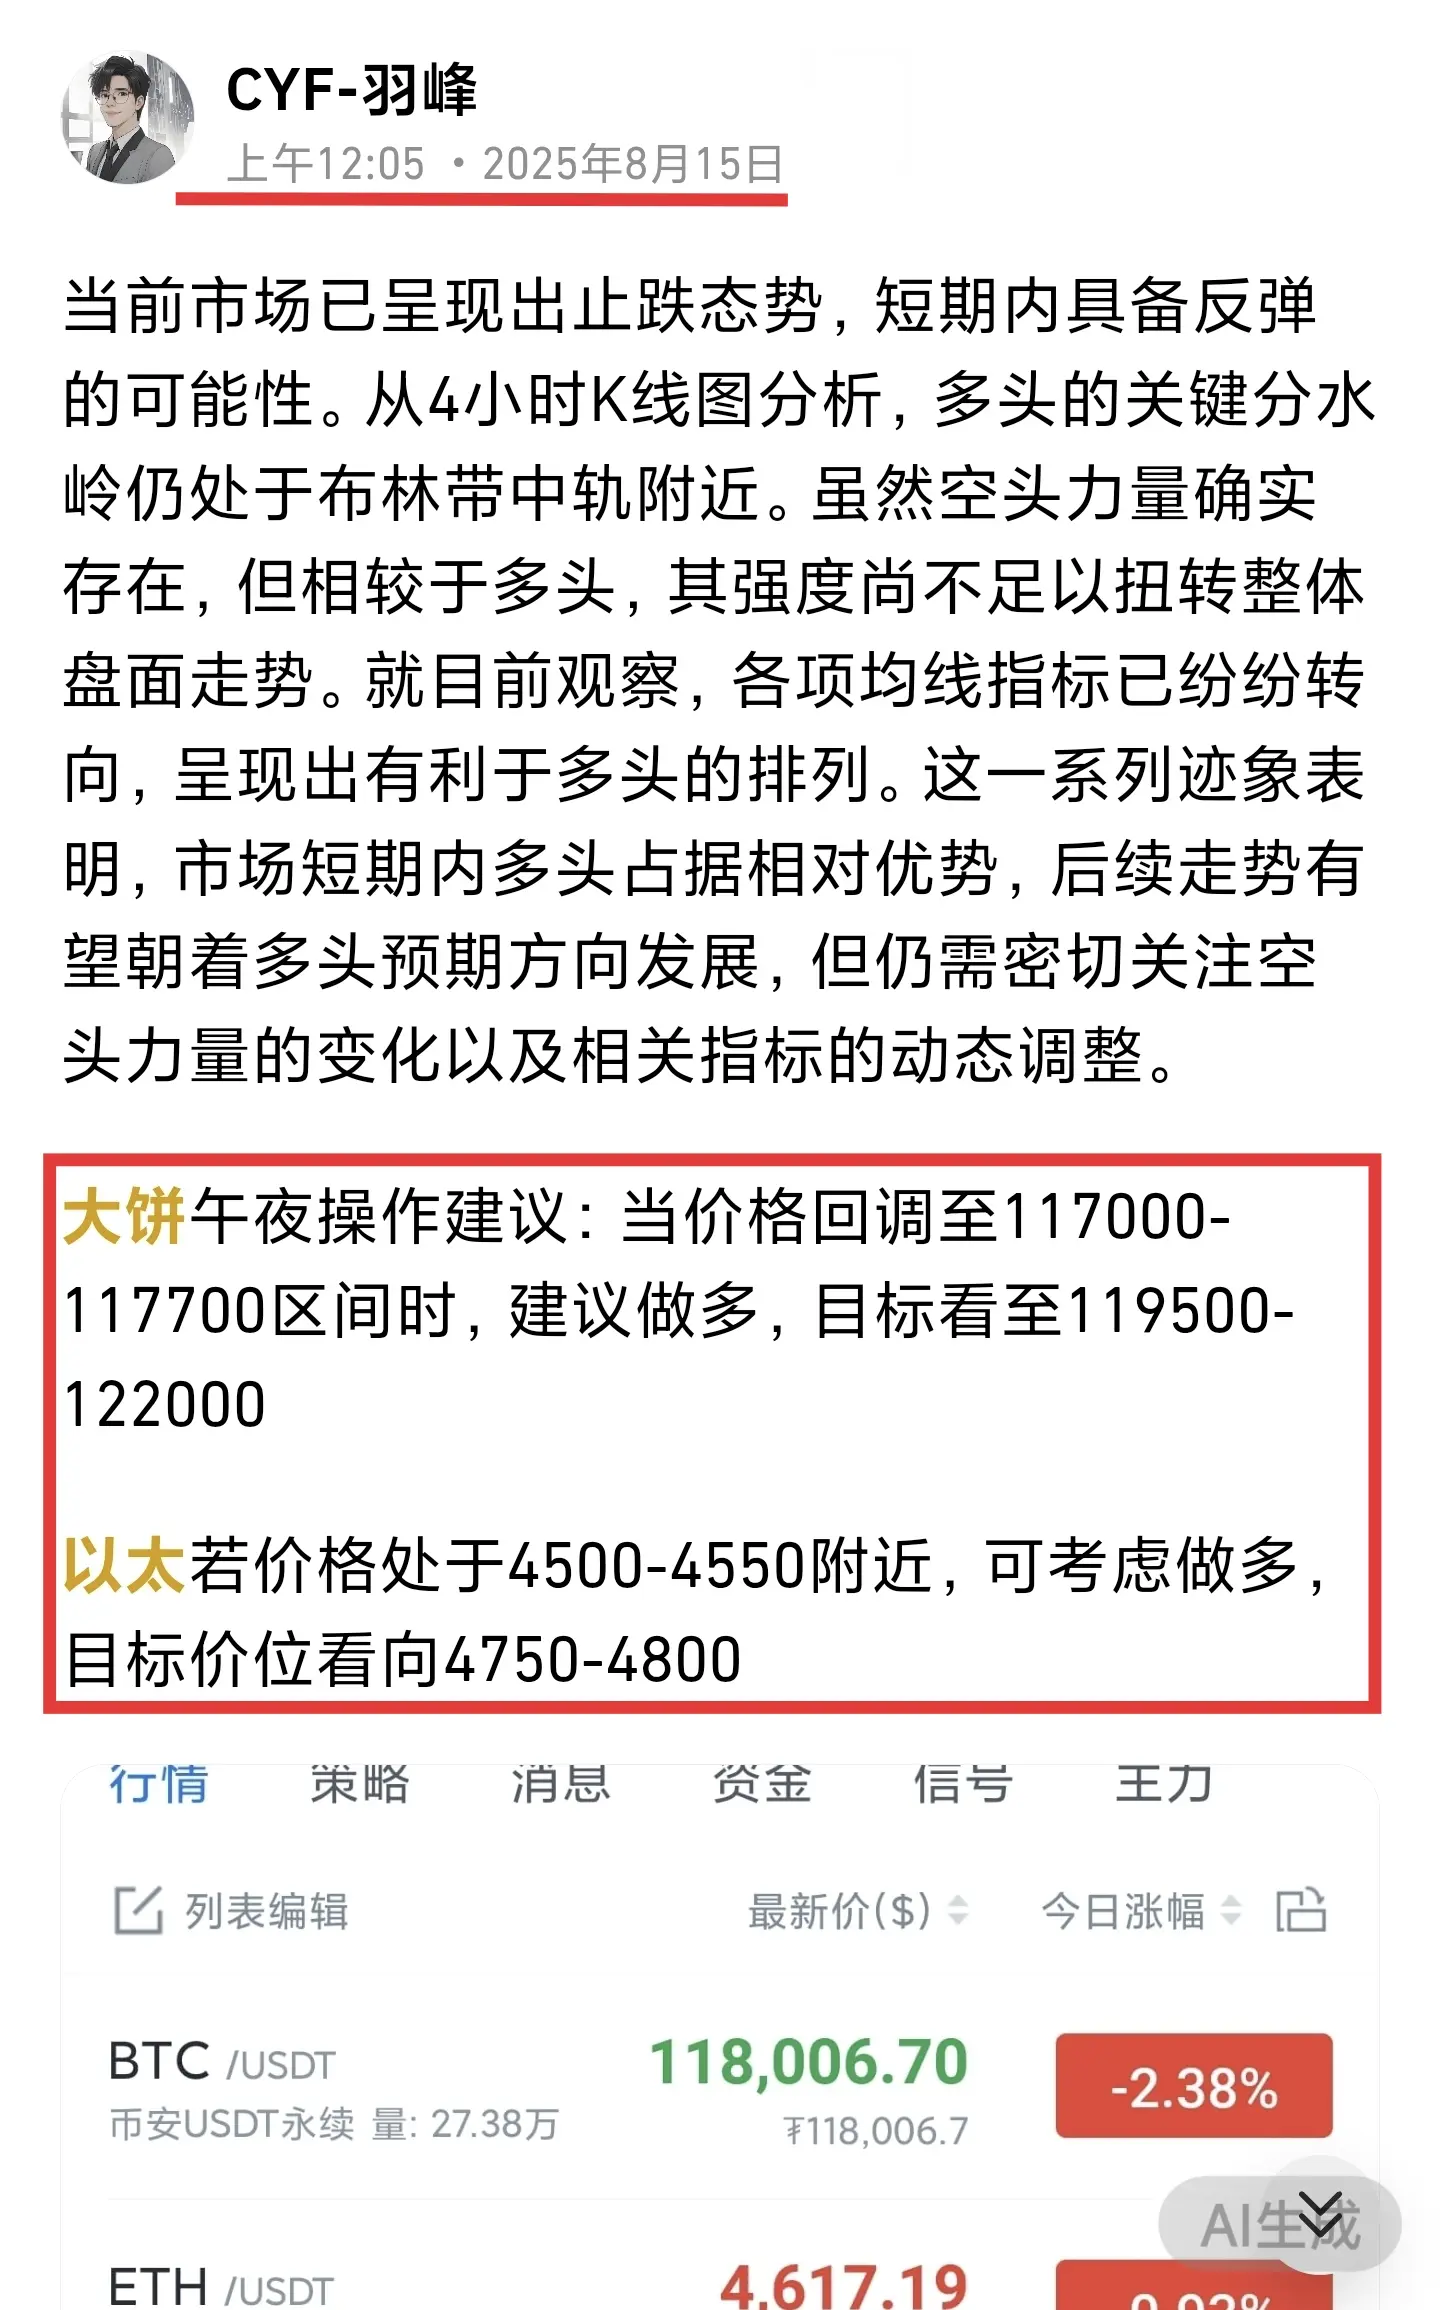
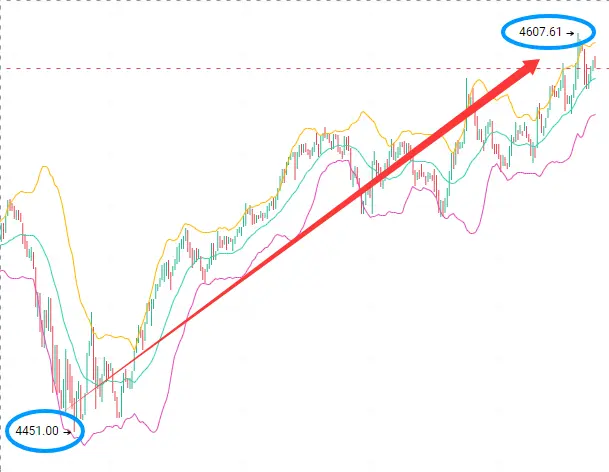
In terms of the current market data situation, the long positions of BTC are very strong, and the indicators of all cycles show an upward trend.
From the weekly K-line perspective, it shows a ladder-like upward pattern. Although there will be pullbacks during the rally, these pullbacks actually provide opportunities for long positions.
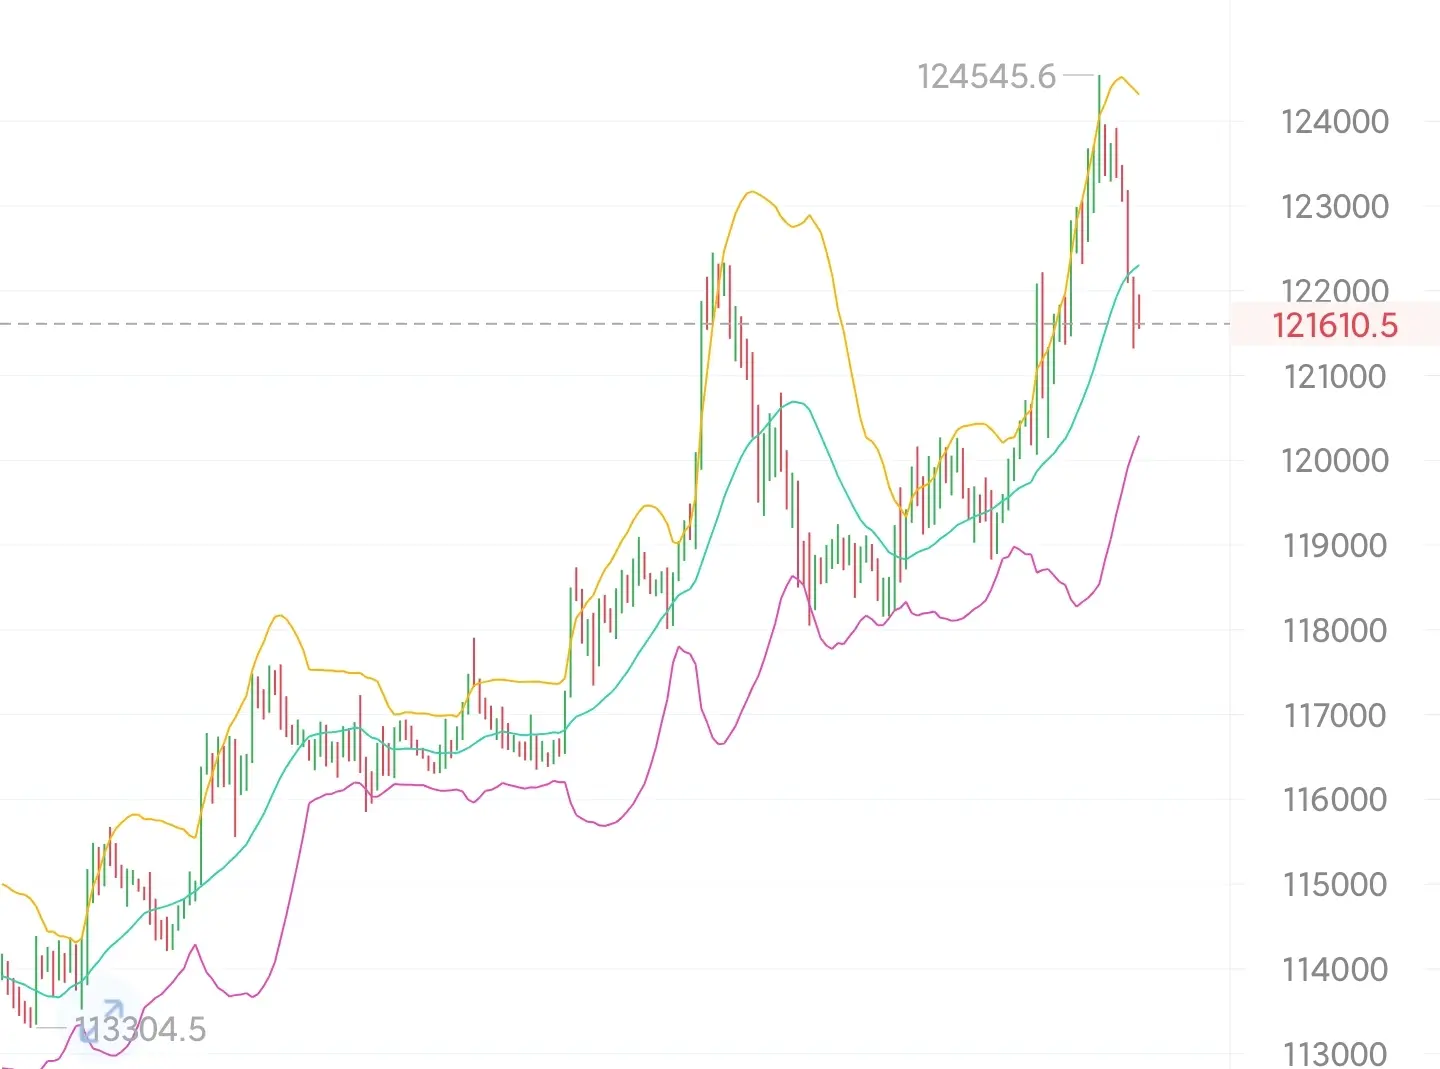
On the four-hour level, the three lines of the Bollinger Bands are opening upwards, and the market is advancing upwards with the middle line of the Bollinger Bands as support. The 120000 level below is forming a short-term support level, and investors can us
From the weekly K-line perspective, it shows a ladder-like upward pattern. Although there will be pullbacks during the rally, these pullbacks actually provide opportunities for long positions.
On the four-hour level, the three lines of the Bollinger Bands are opening upwards, and the market is advancing upwards with the middle line of the Bollinger Bands as support. The 120000 level below is forming a short-term support level, and investors can us
BTC0.83%
- Reward
- like
- Comment
- Repost
- Share
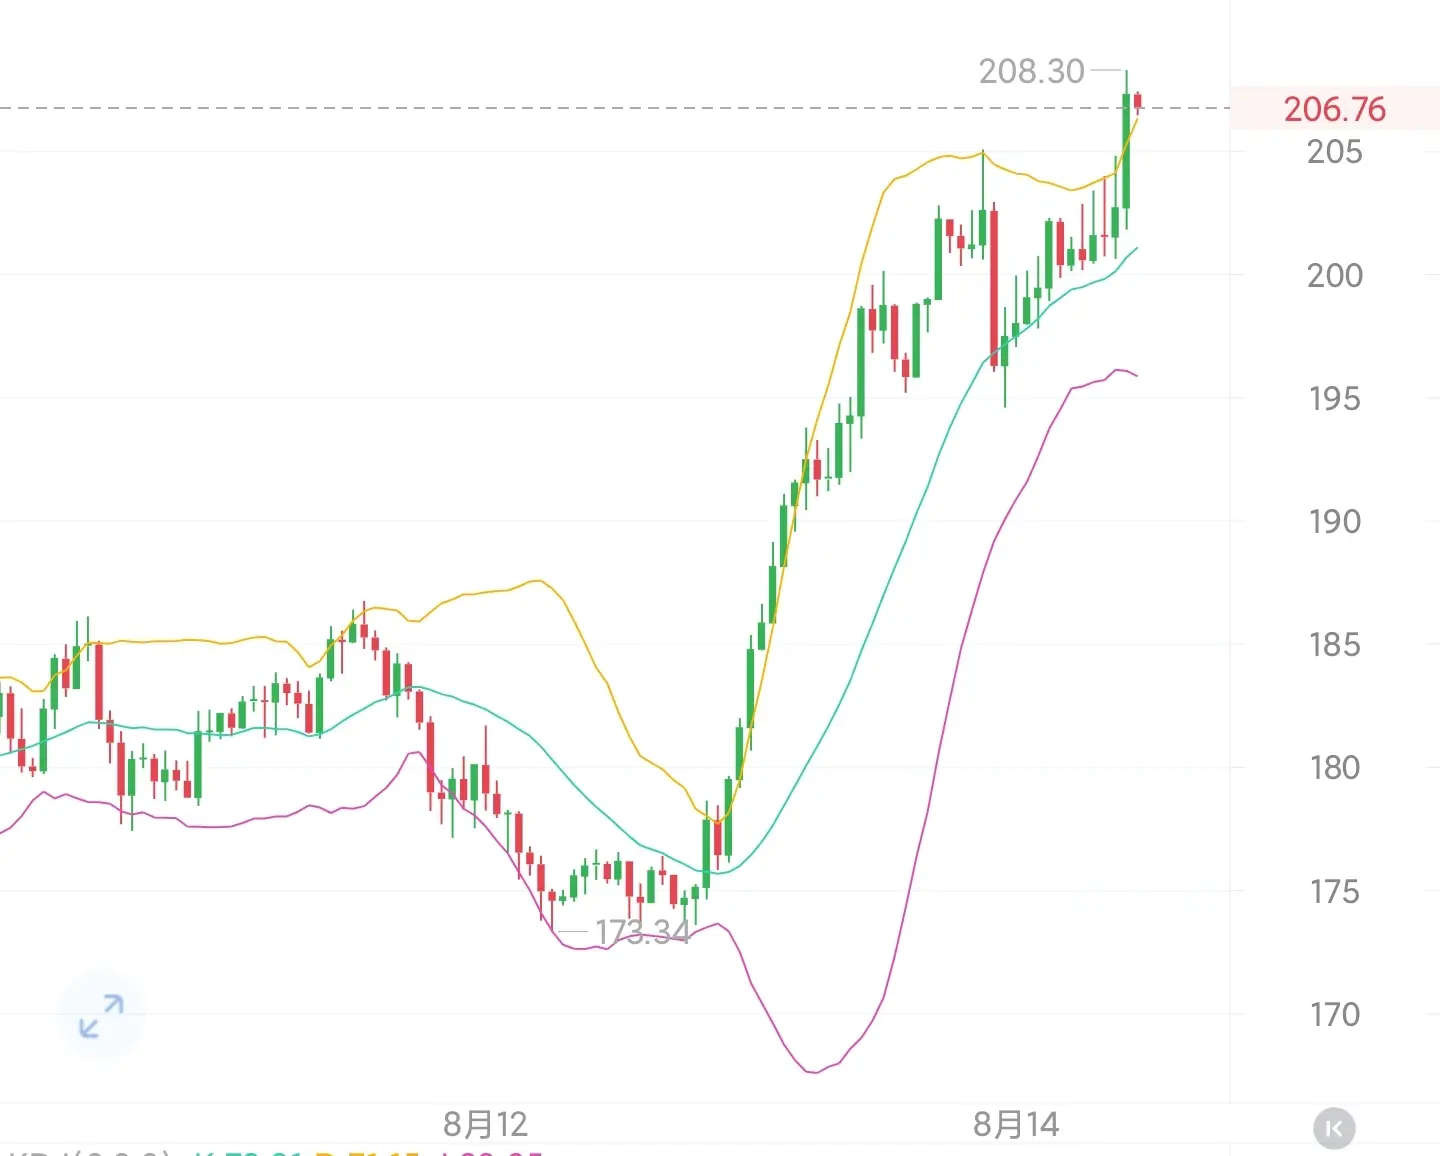
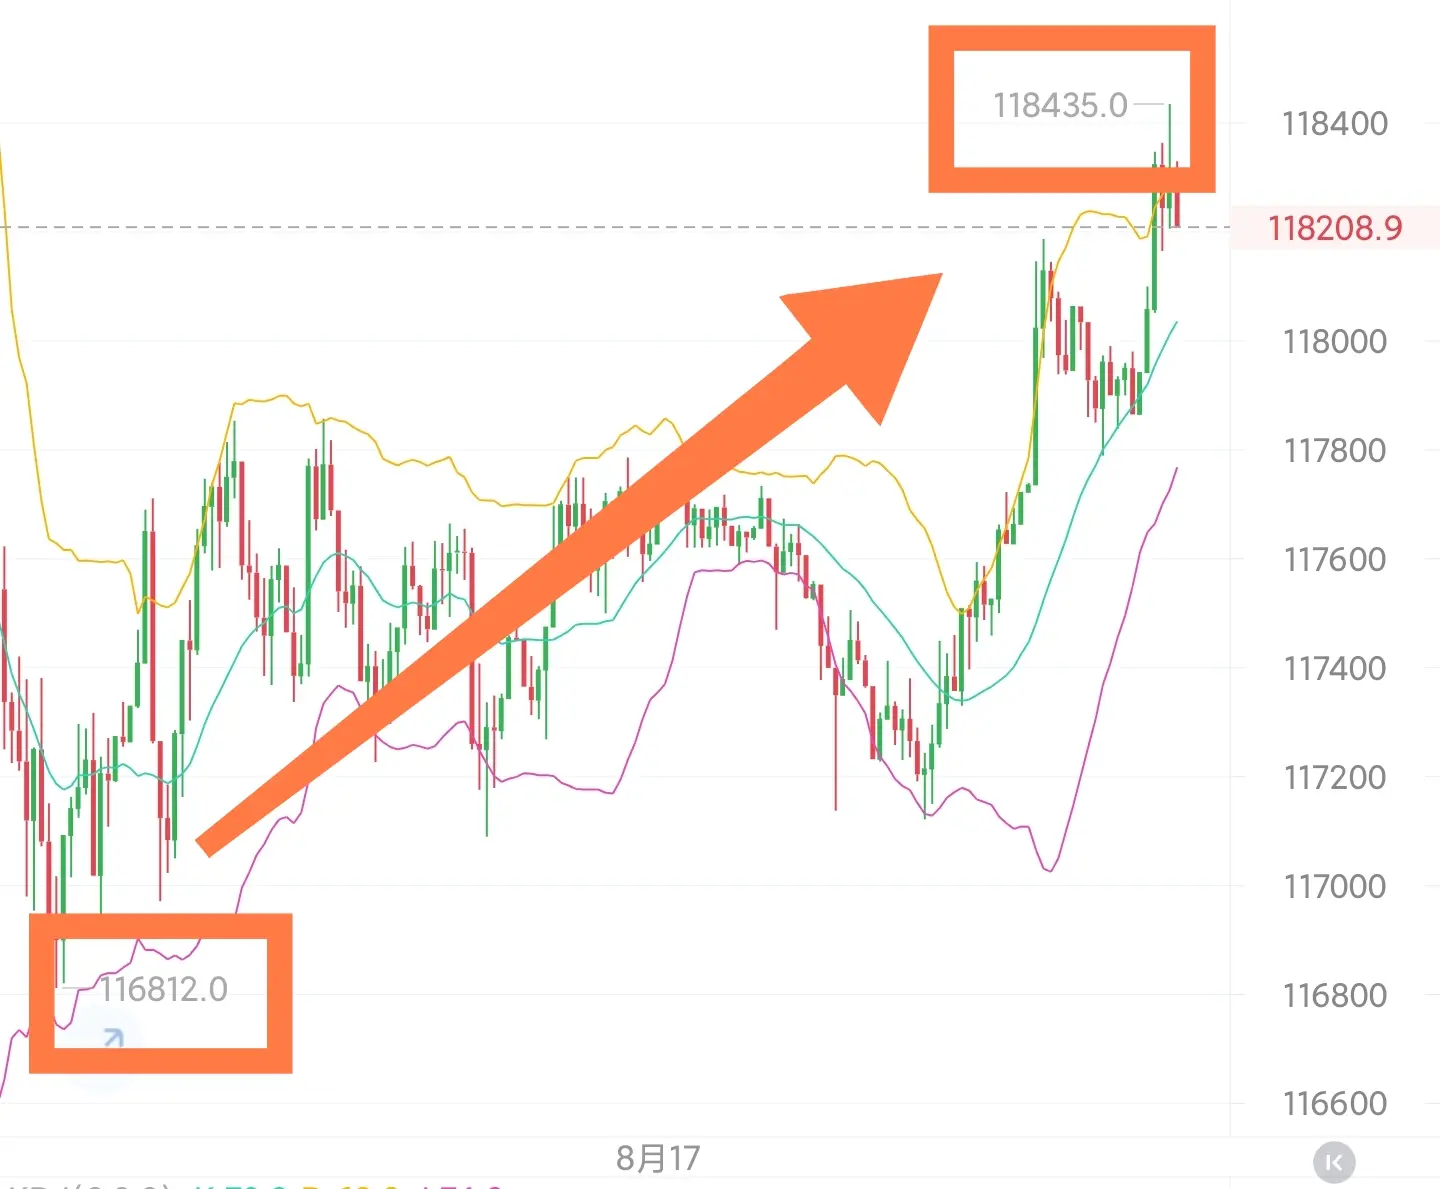
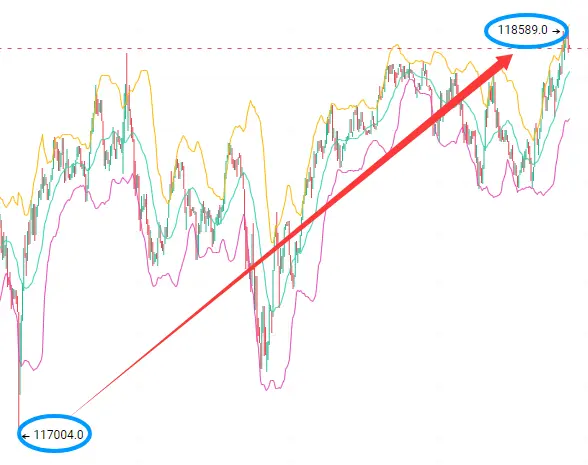
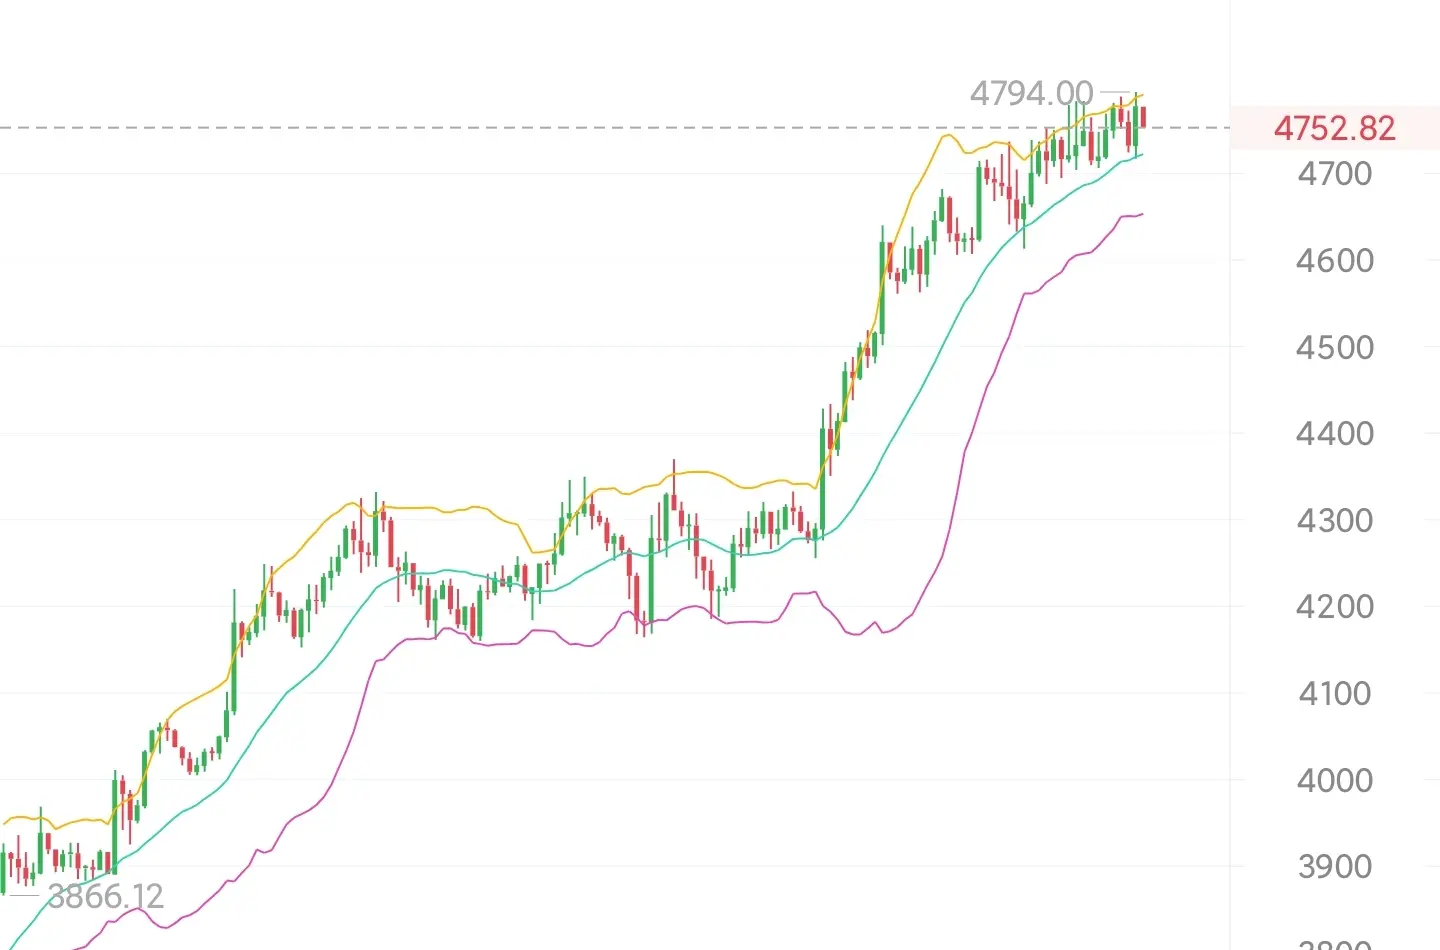
From the four-hour K-line chart, five consecutive bullish candles have appeared, and the price has successfully broken through the upper Bollinger Band. This trend indicates that the bullish momentum is expanding outward, presenting a strong overall structure, with a significant upward trend. At the same time, various indicators also show that the bullish strength still has room for further upward movement.
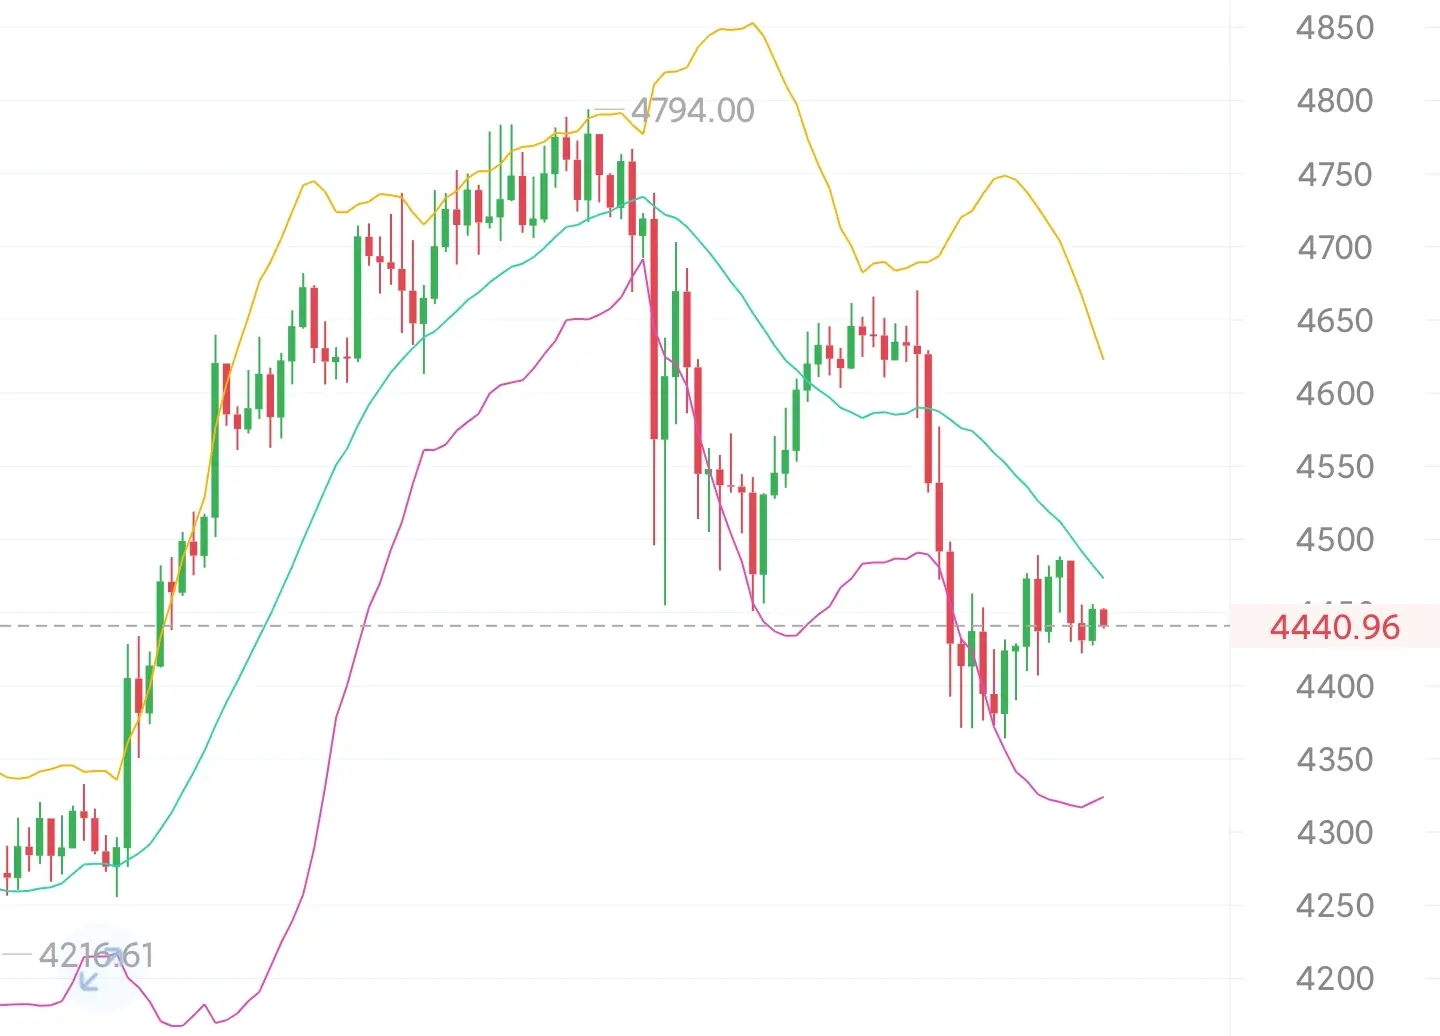
Looking at the one-hour K-line chart again, the price is running closely along the upper Bollinger Band after experiencing a slight pullback, consistently maintaining within the upward ch
Looking at the one-hour K-line chart again, the price is running closely along the upper Bollinger Band after experiencing a slight pullback, consistently maintaining within the upward ch
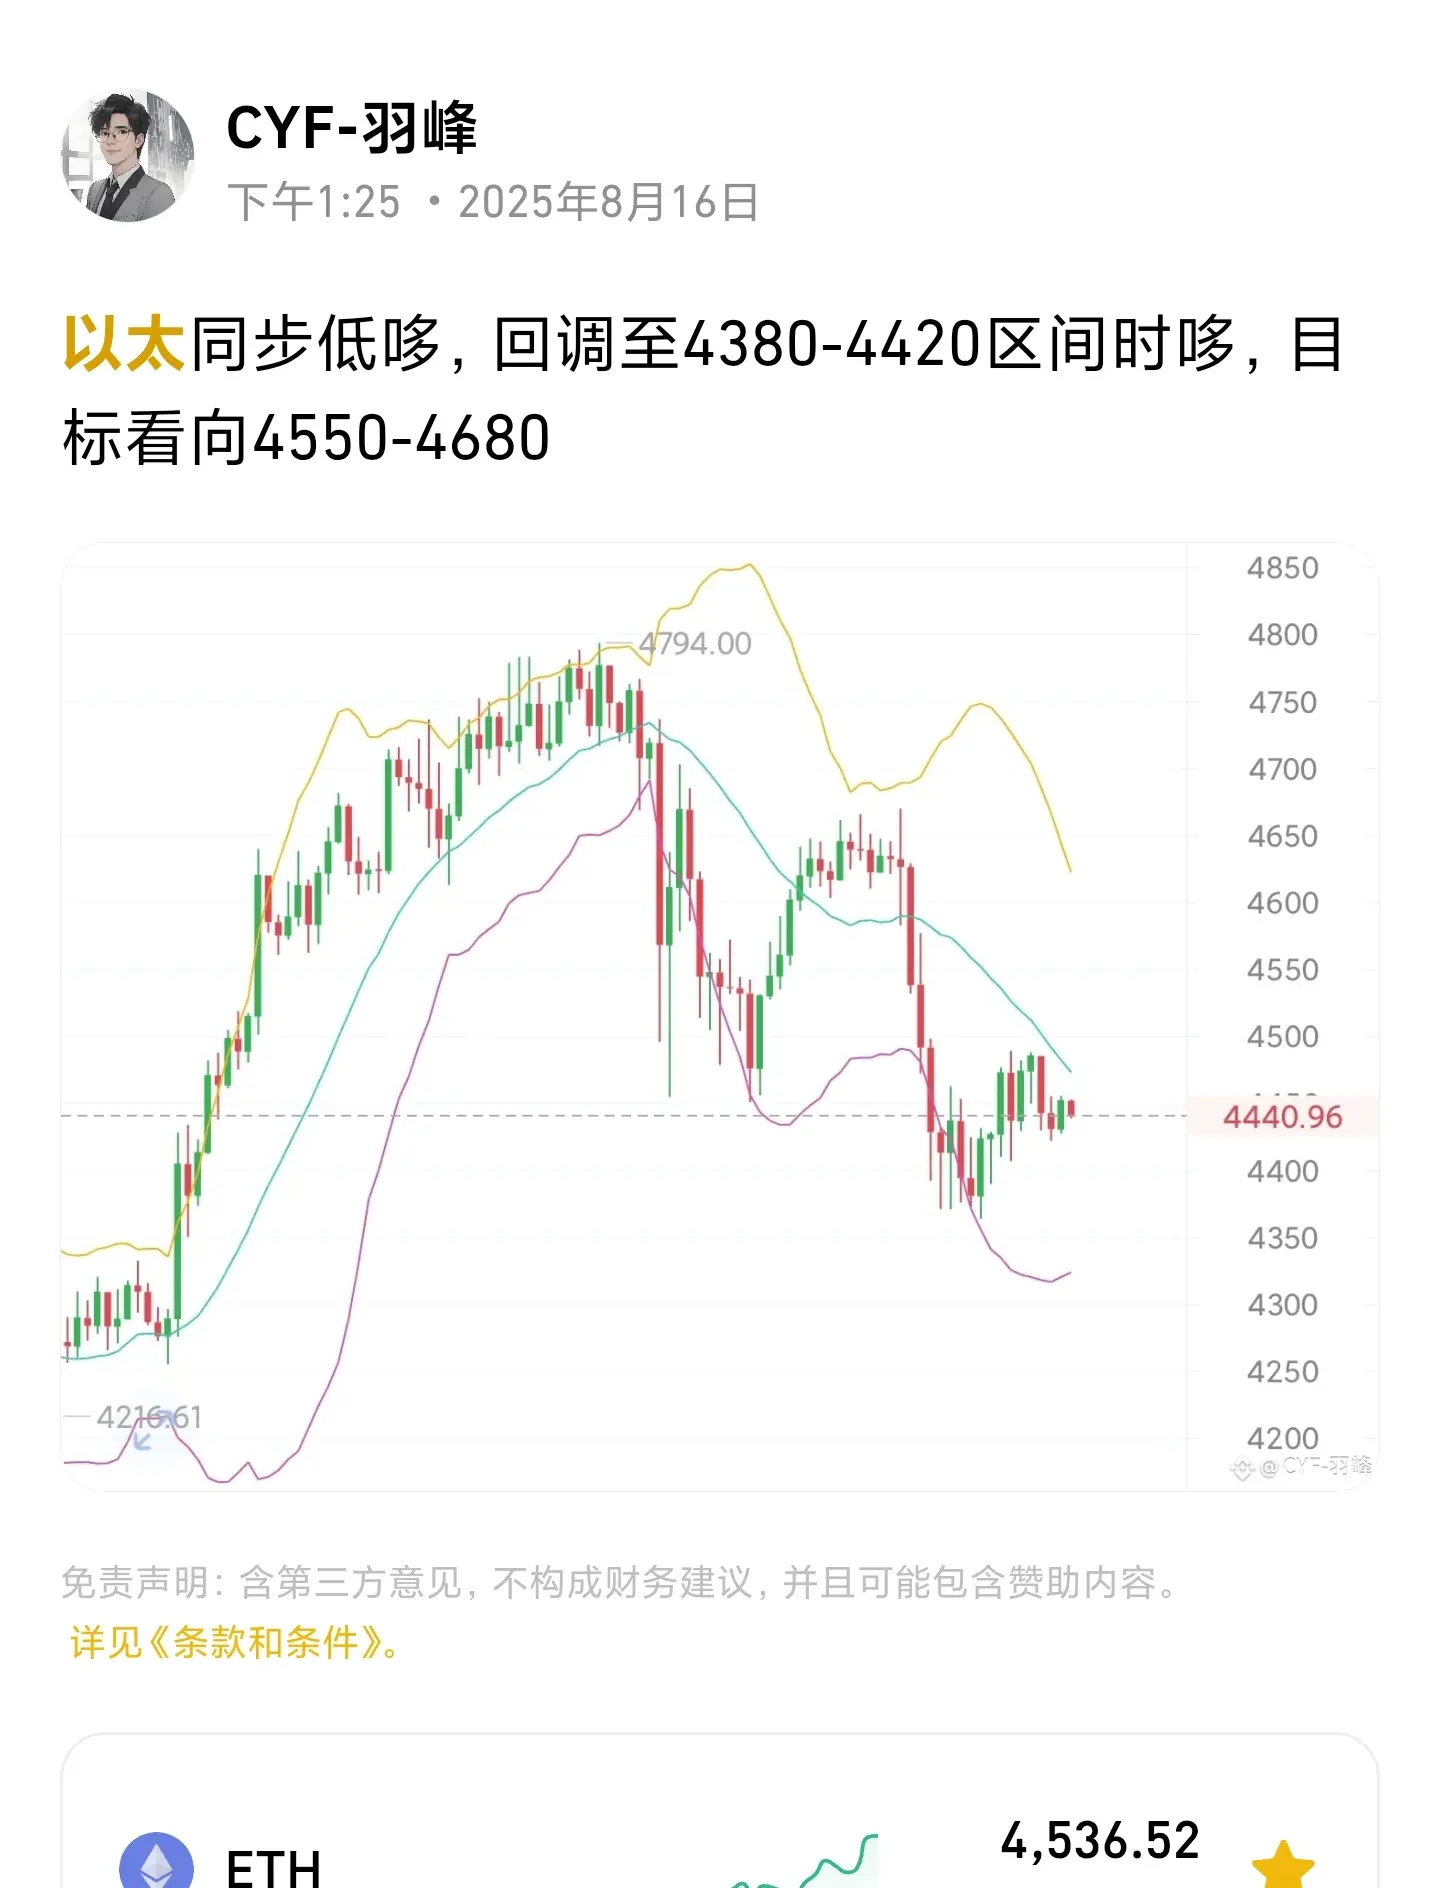
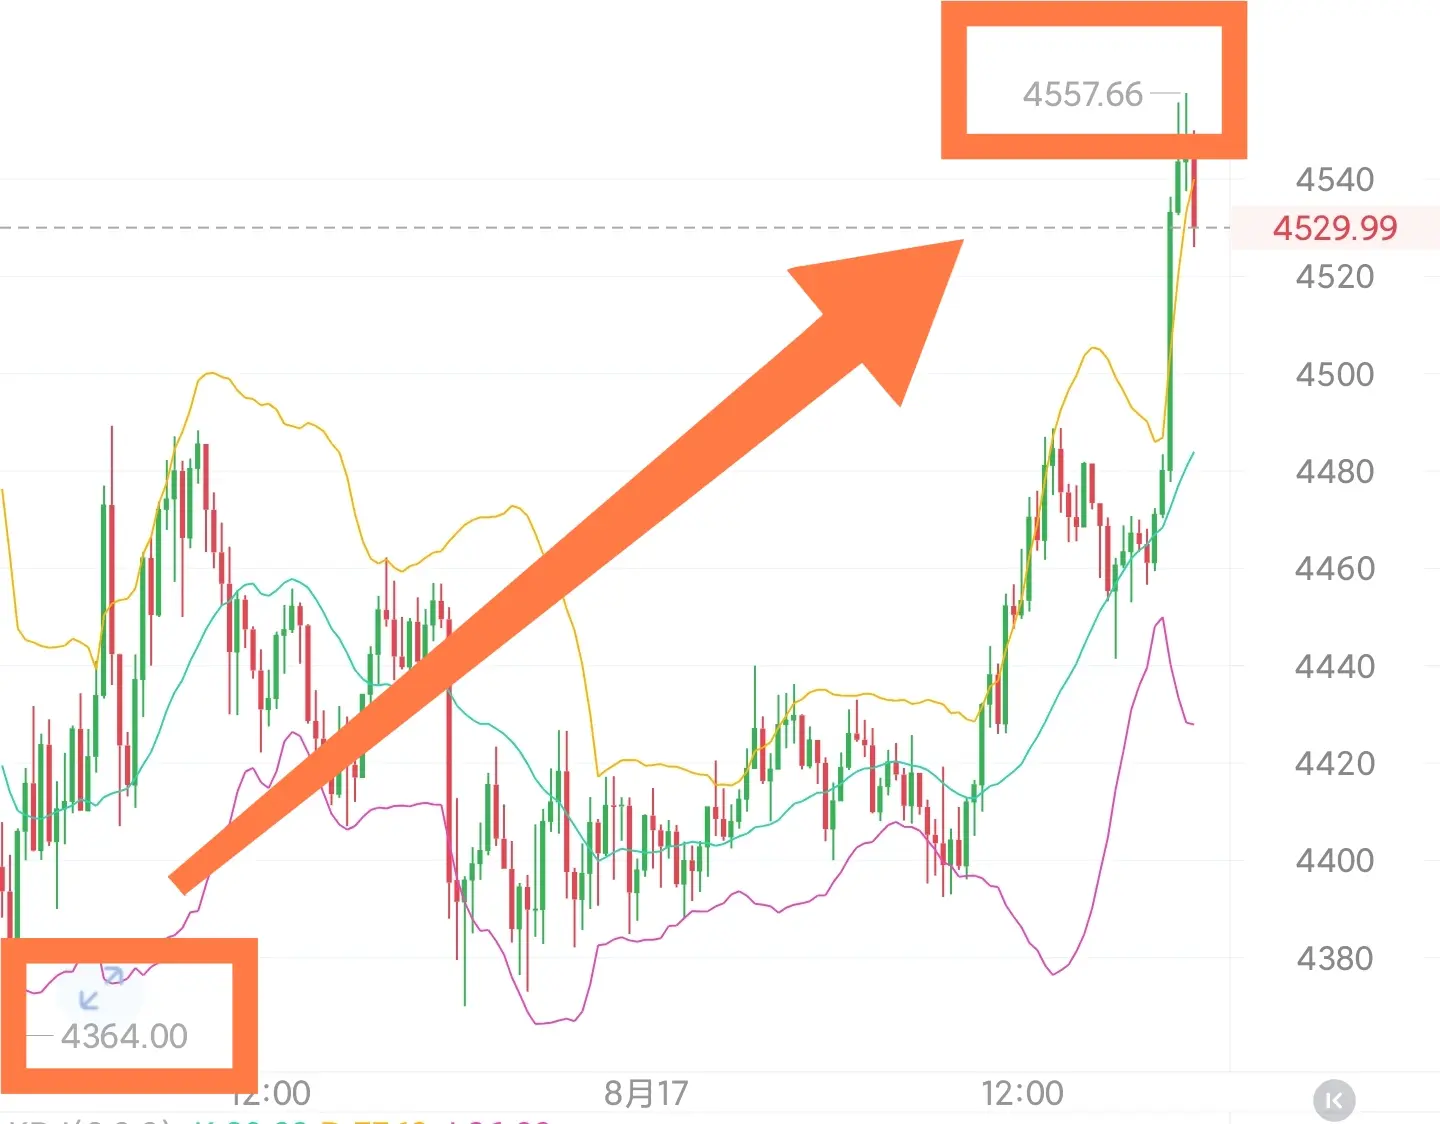
ETH3.47%
- Reward
- like
- Comment
- Repost
- Share